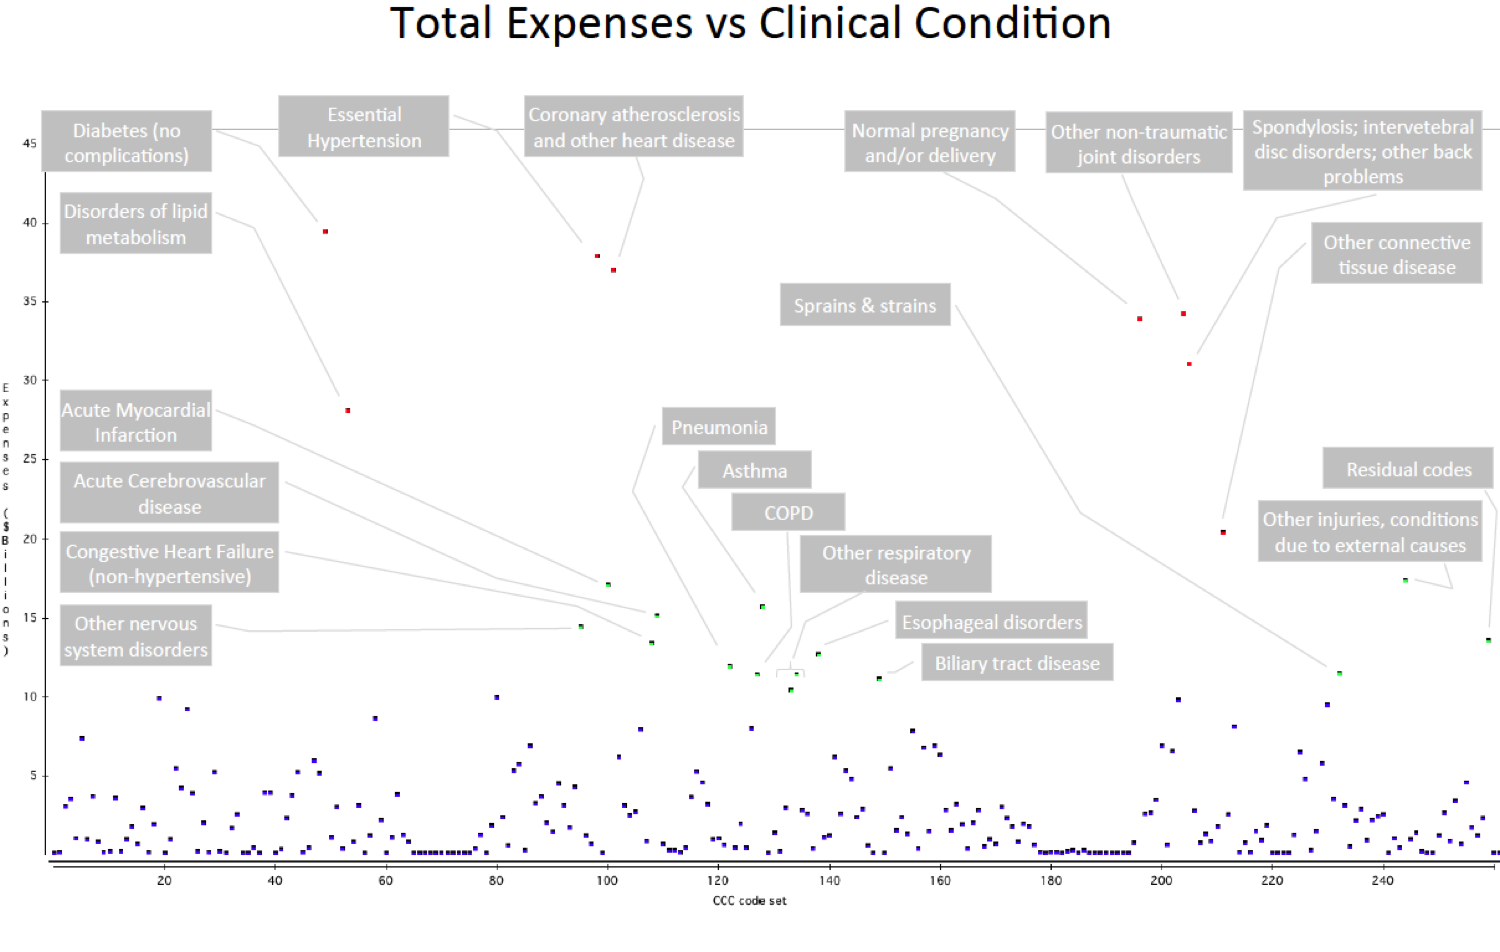
To be actionable, I felt it more useful to look at healthcare costs by specific clinical condition, rather than by the general disease groupings of my last post. Here is the graphic I came up with (excluding mental disease categories for now).
The 8 red dots represent clinical condition codes with annual expenditures each in excess of $20 Billion. The green dots represent 14 clinical condition codes with costs in excess of $10 Billion (but less than $20B).
Disease as function of clinical condition code
Data details
- These numbers include Hospital outpatient visits, Office based provider visits, In-patient stays, ER visits, and Prescribed Medicine expenditures. But they do not include the two additional categories of Home health, and “Other” which are included in the AHRQ totals used in the summary tables of my prior post. Thus the numbers in the more detailed chart above are slightly smaller than the totals in the prior post entitled “Disease through the eyes of an accountant”.
- More details about the source of the data is also in the post linked above.
- Each patient encounter with the healthcare system in the AHRQ database is tagged with up to three Clinical Condition Codes. For this analysis, I assigned each record to the code captured in the first of the three tags. This changes the absolute numbers a little compared to apportioning the expense over each of the three codes, but any errors that result from doing this seem relatively small (<20%).

Leave a reply to Disease economics: COPD and Pneumonia – science to profits Cancel reply