I was interested to see that Back problems are the ninth most costly clinical category in US healthcare at almost $40B / yr. I chose back pain as the second in my series on disease economics.

Most ($31B) of the costs falling into the back problem category come from a single clinical condition code #205 (Spondylosis; intervertebral disc disorders; other back problems).
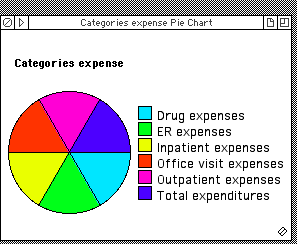
And most of these expenditures go toward hospital in-patient visits/procedures ($11B), and Clinician office visits ($13B).
For the details, read on.
Back problems: Cost per event, and total expenses
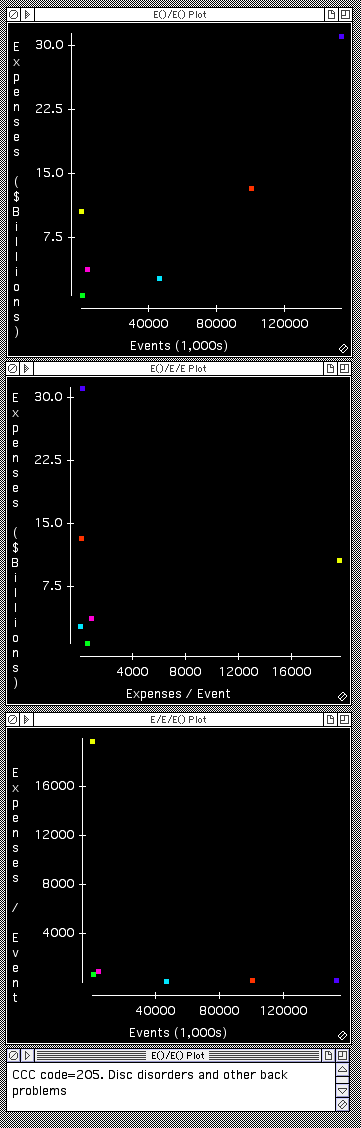
Observations on Backpain economics
The graphs on left show a large number (100M) of office visits at relatively modest cost per visit ($130), and a smaller number (540,000) of quite expensive ($20K per visit) in-patient stays. (Scroll down for the explanation of the color coding)
Backpain business opportunities
There have been a large number of “spine surgery” , venture backed companies over the last couple of decades, and when you look at these numbers you can understand why.
Seen through the lens of cost constrained medicine however, here are a couple of interesting speculations for potential business opportunities. They all involve moving care to less expensive, lower acuity settings.
Backpain triage for surgery
Anecdotally one gathers that some fraction of the 540,000 patients who undergo in-patient back procedures might have done as well or better with more conservative therapy. So, a diagnostic that does a better job of triaging patients who will or will not benefit from in-patient attention might be economically attractive.
If 10% of in-patients avoided admission, that would translate to an annual saving of $1B. Of course, if this came as a result of some type of additional “test” applied to every one of the 100M annual office visits, that test would need to cost less than $10 / test for the overall economics to work out.
Backpain triage for office visits
It’s interesting to speculate about some type of consumer “app” that might be the first stop for patients experiencing back pain, prior to an office visit to consult a clinician. The opportunity here would be to enable some patients to avoid a visit altogether, to catch some patients earlier in their disease progression when intervention might be more effective, and perhaps to create an opportunity for preliminary interaction with non-physician caregivers as an initial triage step.
Imagine use of interfaces like Kinect or Wii, and perhaps some remote range-of-motion measurement using cameras, and perhaps some type of big data, cloud-based backend to help improve triage and prognosis over time.
In terms of economic impact, there are all sorts of complexities behind this idea. Too many to really go into here. A very simplistic view could be that if an “app” cost $10/encounter, and led to reduction in office visits by 10% when used by the entire 100M office visit candidates, roughly $1B in overall expenditures would be shifted from office visits to “app” revenue, and the overall exercise would be cost neutral.
In reality, one would need to consider that the source of funds might be quite different in each case. The “app” fee would likely come directly from the patient, while the office visit fee would likely come at least in part from an insurer.
And it would be important to consider the clinician’s economic interests in thinking through the business model.
It would be fascinating to brainstorm further this whole idea. If it interests you, let me know and we can discuss.
Data footnotes
- Data comes from AHRQ (details here and here).
- An Event is a “stay”/”visit” typically for clinician encounters, and a “purchase” for a drug.
- There are some unexplained discrepancies in the magnitude of “visits”. And all these numbers differ a bit from other sources when it comes to patient numbers and disease incidence. The strengths of this data set is that it includes expenses. I recommend some caution regarding absolute numbers and would not rely on them to better than a factor of 2. The Relative numbers are probably reasonable.
- Coding comes from patient self reporting, so not super accurate.
Initial Image credits:
© Ribah2012 | Dreamstime.com

Leave a comment